Visualizing the COVID-19 Impact on U.S. Charter Activity
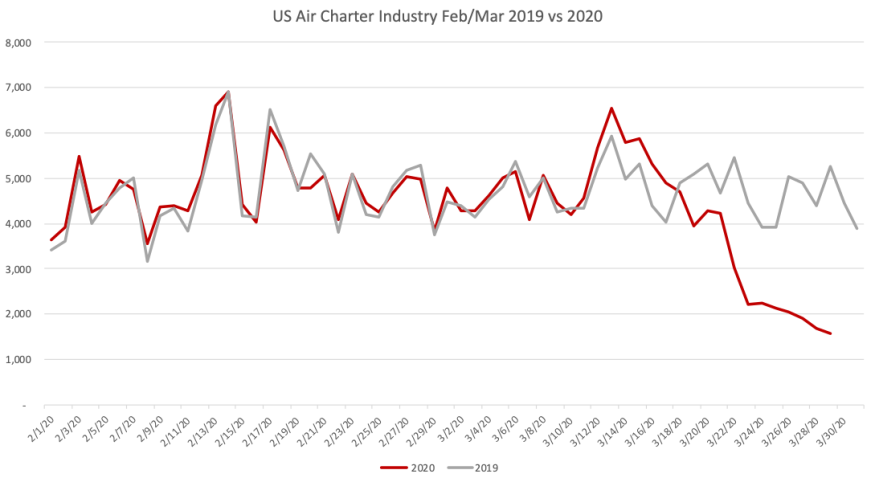
/During clearly the most challenging time in history for both commercial and business aviation, B2B charter company Tuvoli has offered the following statistical look at the impact on the charter industry. The graph compares flight hours per day among Part 135 and 91K operators between 2019 and 2020.

Tuvoli processes more than 50 million flight tracking messages per day directly from FAA data feeds. That data is used to power the live flight tracking in the Tuvoli platform, and the archived information is the basis for the graph. Tuvoli uses these criteria to filter the FAA data and produce the graph:
- Aircraft flying under call signs known to be air charter/fractional operators

- Tail numbers on Part 135 certificates from the latest FAA information distributed by AFS 260 (Technical Programs Branch), which is compiled by the FAA from D085s
- Aircraft types limited to private jets, King Airs, and Pilatus PC-12s
- Numbers reported are total flight hours per day
“The chart is hard to look at since it represents an unsustainable drop in overall air charter volume,” Johnson says. “Hopefully hard data like this will be helpful to NBAA and those working to provide economic stimulus to keep critical segments of our economy, like air transportation, alive.”
Notably, during the most recent seven-day period, the drop off in activity seems to be slowing even with many U.S. states continuing efforts to expand social distancing.
To learn more about Tuvoli, visit www.tuvoli.com.
